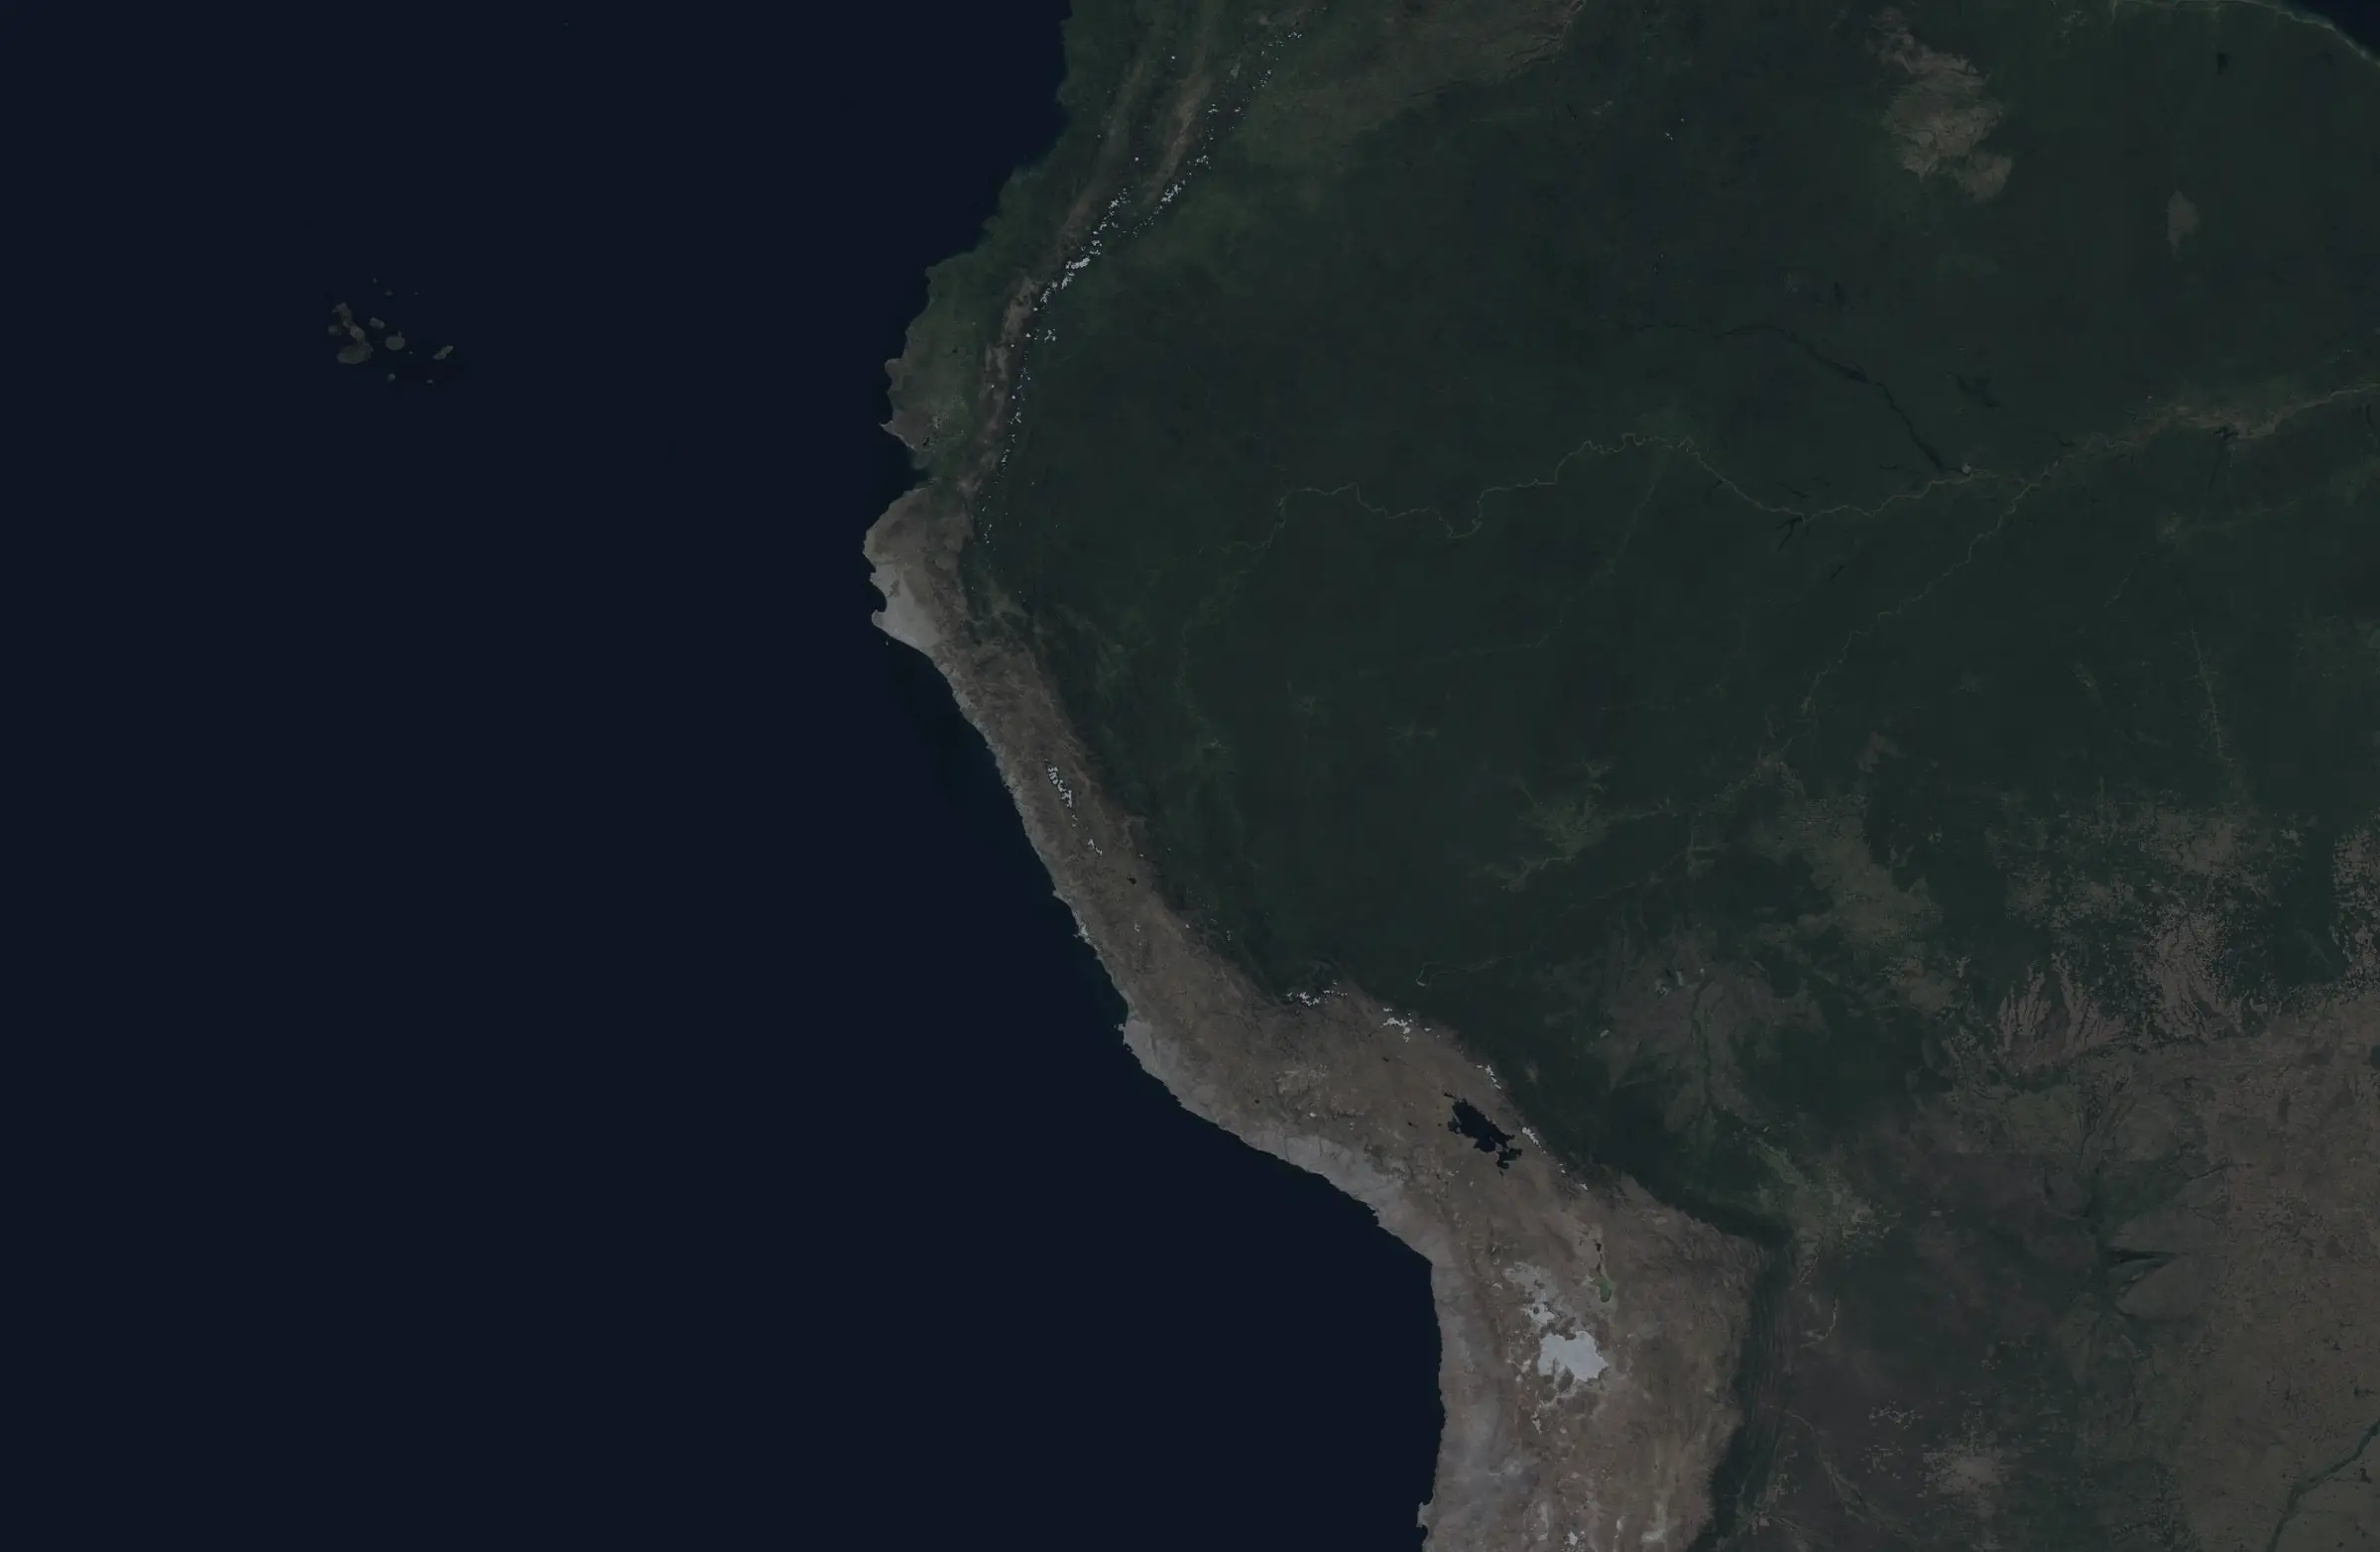
Method · MODIS + VIIRS harmonization
The camera changed,not the fire.
VIIRS counts almost nine times more hotspots than MODIS. We correct it so twenty years of data speak the same language.
- Apparent jump 2011 → 2012
- ×8.9
- After harmonizing
- ×1.3
- Comparable record
- 23 years
adding without adjusting
same VIIRS scale
2003 – 2025
Figures computed with NASA FIRMS data for Peru (vegetation fires, nominal and high confidence). The harmonized series comes live from the backend API.
Four steps, one record
Pick a step: from raw data to the final number with its range.
Data
NASA's fire hotspots, sorted by month and by region.

Overlap
Between 2012 and 2022 the two satellites overlap in time.
Model
We fit each territorial unit when there is enough data.
Range
Every estimated year carries an interval, not an exact number.
Before and after correcting
With the data as it arrives, fire seems to explode in 2012 and again in 2018. Switch between the two views and compare: once corrected, the series can be read year by year.
- Satellites added
- Harmonized series
- Estimated year (with range)
Each dot is a year. The dotted line is what the satellites count when added; the solid one, the corrected series, where years can actually be compared.
Hover over the chart, or use the arrows ← →
2012
- Added
- 92,738
- Harmonized
- 75,993
What happened in 2012
×1.7
With a single satellite
With MODIS data alone, from 2011 to 2012 the count barely changes.
×8.9
Adding both
The same year, adding both records looks like a huge increase.
81 %
Comes from the new sensor
Of the 2012 total, that share comes from VIIRS, which is just starting.
Annual series of Peru's hotspots from the backend API (calibration v1, frozen). Years before 2012 are estimates with their range, not observations. The “as they arrive” line adds the raw MODIS and VIIRS counts.
We tested it blind
We trained on 2012–2019 and hid 2020–2022. Then we compared what the model predicted with what VIIRS actually counted.
Accuracy of the monthly total (R²)
Most of the month-to-month variation in Peru is explained.
Typical error per month
In a normal month, the national estimate is off by about 13 % from the real value. The ring shows that 13 %.
Months within the range
63 of every 100 real months fell inside the range we announced.
Metrics from the backend's validation: the model was fit on the training years and measured on years it never saw.
Try it yourself
For anyone who wants to audit: play with the model, see how we validated it, which assumptions we made and each region's parameters, downloadable.
Pick a region and how many hotspots MODIS counted in a month. The model works out how many VIIRS would have counted: the same calculation we use to translate the years before 2012.
Pass the cursor over a term to see what it means for this region.
You choose
This region has its own fit.
The model estimates
≈ 1,536
hotspots on the VIIRS scale for that month in Ucayali — about 5.1 times what MODIS counted.
Same formula the pipeline applies to each department-month before 2012, with the official calibration v1 and the Duan smearing correction.
How it got to that number
- 1We take MODIS to a logarithmic scaleln(300 + 1) = 5.71
- 2We multiply it by the slope b0.78 × 5.71 = 4.46
- 3We add the base level a and the high-season adjustment d4.46 + 2.53 + 0.30 = 7.28
- 4We undo the logarithm (with the Duan correction)1.06 × e^7.28 − 1 ≈ 1,536
Everything here is the official calibration v1 of the backend, read live from its API. If the team publishes a new version, this section updates itself.